
“Heber is currently growing at a rate of 4.36% annually and its population has increased by 64.06% since the most recent census, which recorded a population of 11,362 in 2010.” – World Population Review
For a relatively small metro (around 18,000 residents), only four cities in the country attracted more growth during the pandemic than Heber.
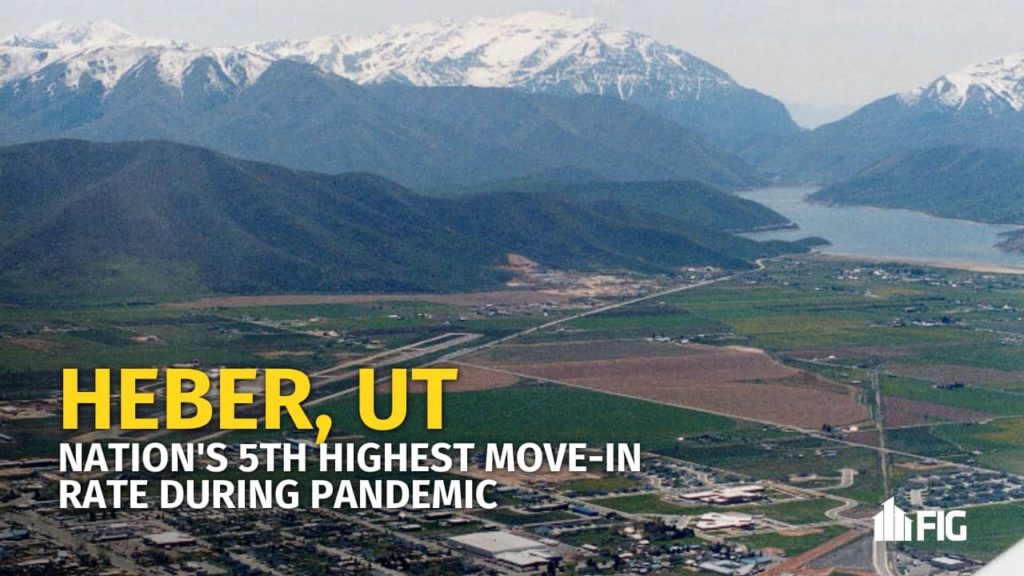
Heber ranked fifth in a study cited by New York Times which mapped out where people have been moving during the pandemic. This includes people from both out-of-state and those moving from Park City, and Utah/Salt Lake Counties.
“Controlling that growth is the challenge, making sure that it reflects the quality of life that existing residents currently enjoy,… gorgeous views [of] Mount Timpanogos and access to the metro area.” – Shawn Seager, Mountainland Association of Governments
Heber also provides a more rural atmosphere for the community to enjoy while still being within an hour of Salt Lake City and the Airport. Locals enjoy being tucked away in the mountains with a short drive to multiple ski resorts while still having a Costco 20 minutes down the road…
Metros Showing Highest Change in Net In-Migration
| 2019 Change | 2020 Change | 12 Month Shift | ||
| #1 | Hudson, N.Y. | -1.0% | +8.7% | +9.7 pts. |
| #2 | Kingston, N.Y. | -1.6% | +3.6% | +5.2 pts. |
| #3 | Torrington, Conn. | -0.8% | +3.6% | +4.4 pts. |
| #4 | Barnstable Town, Mass. | -0.7% | +3.4% | +4.2 pts. |
| #5 | Heber, Utah | +0.7% | +4.7% | +3.9 pts. |
| #6 | Pittsfield, Mass. | -1.4% | +2.5% | +3.9 pts. |
| #7 | Lebanon, N.H. | -2.6% | +1.1% | +3.7 pts. |
| #8 | Panama City, Fla. | -0.8% | +2.6% | +3.4 pts. |
| #9 | Aberdeen, Wash. | -3.3% | 0% | +3.4 pts. |
| #10 | Naples-Marco Island, Fla. | +2.6% | +6.0% | +3.3 pts. |
(926 metros analyzed)
Metros Showing Highest Change in Net Out-Migration
| 2019 Change | 2020 Change | 12 Month Shift | ||
| #1 | Lake Charles, La. | -1.7% | -6.7% | -5.0 pts. |
| #2 | Odessa, Texas | -2.3% | -5.6% | -3.3 pts. |
| #3 | San Fran.-Oakland | -2.0% | -4.8% | -2.8 pts. |
| #4 | Hobbs, N.M. | -1.4% | -4.0% | -2.6 pts. |
| #5 | Midland, Texas | -1.6% | -4.0% | -2.4 pts. |
| #6 | New York | -4.0% | -5.7% | -1.7 pts. |
| #7 | San Jose, Calif. | -2.1% | -3.8% | -1.7 pts. |
| #8 | Gillette, Wyo. | -1.0% | -2.4% | -1.4 pts. |
| #9 | Seattle-Tacoma | -0.7% | -2.1% | -1.3 pts. |
| #10 | Boston | -1.7% | -2.7% | -0.9 pts. |
(926 metros analyzed)