
It’s a fact that housing permit activity has shot up in the last couple of years—not just in Phoenix, but in Arizona as a whole. Data suggests that total permits were up 24.7% by September 2020 compared to the same time in 2019.
Multi-family permits were also up with a 27.5% increase and single-family with a plus 23.7%. This preliminary seasonally adjusted data started out strong in Q1 2020, then slowed down in Q2 only to pick up again by the end of summer. This is despite the weakened construction job market during the pandemic.
Phoenix Metro
- Total Permits: +29.9%
- Multi-family Activity: +38.5%
- Single Family Activity: +26.4%
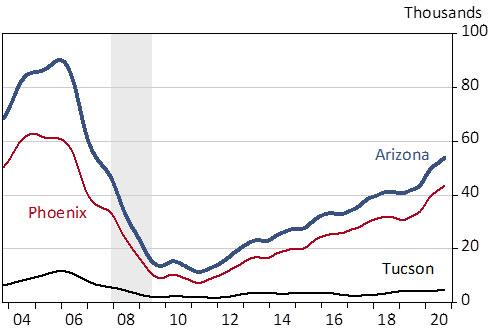
Housing Permits in Arizona, Phoenix, and Tucson, Annualized, Trend-Cycle Component
Arizona Claims for Unemployment & Pandemic Assistance (updated weekly)
National Claims for Unemployment & Pandemic Assistance (updated weekly)
Arizona/U.S. — Seated Dining. (percent change compared to previous year)
Arizona/U.S. — Travel to Retail/Recreation (percent change compared to previous year)
*All charts/data came from the University of Arizona Economic and Business Research Center (report)